Every year ensuring all business processes are under control is getting harder as the massive volumes of data challenge businesses of various sizes. When it comes to sustainable and profitable decisions, companies and organizations, need certain help. In this rapidly growing world of today, each challenge can be addressed promptly by utilizing the modern and professional BI tools.
Business Intelligence (BI) tools are the kinds of software used to gather, process, visualize and analyze a large volume of past, current and future data in order to create interactive reports, generate actionable business insights, and simplify the decision making process.
In here we’re going to discuss what is a BI tool, offer the most prominent benefits that a company can obtain by using them and provide a list of the best BI tools on the market with a review of each.
Sit tight to explore and learn about the best BI tools for your business.
Features of The Best BI tools
1. BI tools bring together all relevant data:
Whether you work in a small organization or large enterprise, you probably collect data from various portals, ERPs, CRMs, flat files, databases, APIs, and much more. You surely need to obtain a high level of data intelligence to be able to manage all these sources and develop a better understanding of the collected information. And that’s why utilizing modern digital tools will help you in centralizing all sources and provide you with a single point of view on all your business processes. That way, identifying trends, issues, and taking actions are based solely on data which are closely connected.
2. Unlock data access for self-service analytics:
If equipped with modern BI tools enable each person to explore the data on their own. Requesting reports from the IT department is significantly reduced, which will help them to focus on other critical tasks. Moreover, this self-service BI approach gives companies a competitive advantage because each employee will be equipped with the right amount of data analytical skills that will ultimately, save the company’s time and extra money.
3. Take advantage of predictions using BI tools:
Predictive analytics doesn’t need to be a speciality of only data scientists or analysts. With the help of BI tools, business users also can generate insights for future scenarios and make strategies to help the company. On the other hand, if anything changes in the business, there are features in BI tools which will safeguard the anomalies that can occur while you manage huge amounts of data. Also, discovering new trends and act immediately can be possible with these amazing tools.
4. Business costs can be reduced significantly:
From sales planning and customer behaviour analysis to real-time process monitoring and offer optimization, BI platforms enable faster analysis, planning and reporting. A survey conducted by the BI survey shows, more than 50% of business intelligence users experienced that these are the most prominent benefits that helped them increasing revenues and reducing costs. Furthermore, you can achieve far better business outcomes and make profitable adjustments effectively.
5. Constant service of 24/7/365:
The software can scale or de-scale, thus, adjusting to the specific needs of a company, according to your needs. Since the data is stored on a cloud, you have all-time access to the software, where you can fully explore various self-service analytics features no matter if you’re a manager, data scientist, analyst or consultant 24/7/365.
Top 10 BI Tools With Top Features
1. Power BI
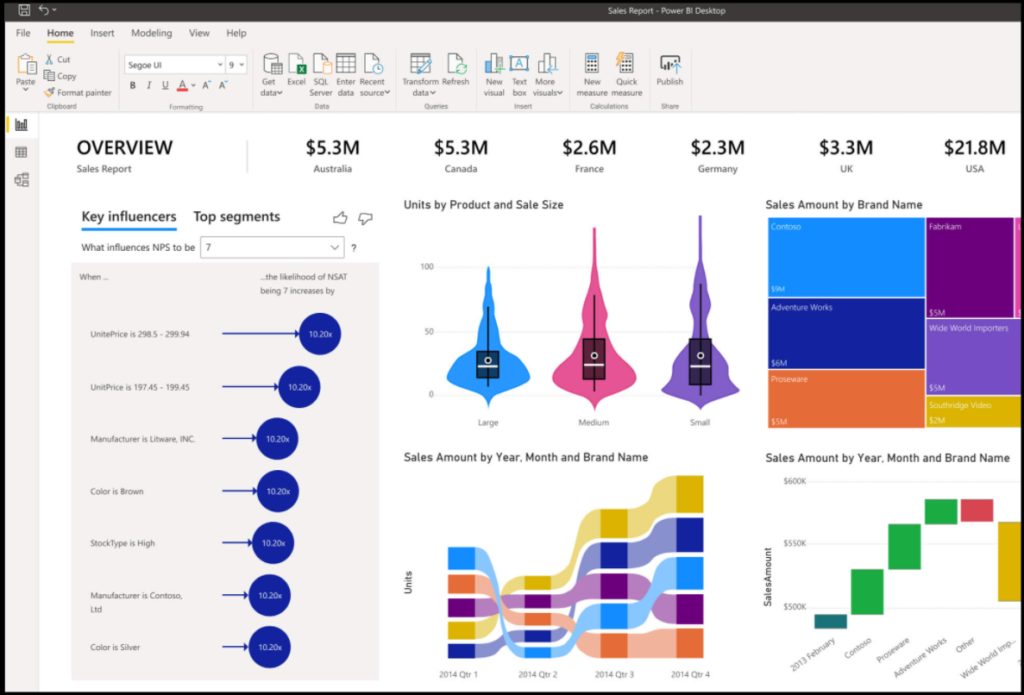
The Power BI platform is a part of service by Microsoft BI Suite, which aims to provide interactive business intelligence and visualization capabilities with an interface simple enough for end-users to create their own reports and dashboards. Microsoft BI Suite has a range of products for various needs: Power BI Pro, Power BI Desktop, Power BI Mobile, Power BI Embedded, and Power BI Report Server. Moreover, this BI tool enables ingesting, processing and reporting data in the form of visuals and reports to provide users with self-service BI and agile analytical capabilities. Be a master in Microsoft Power BI and show the magic in the corporate world!
Top features:
- Integration with hundreds of supported cloud-based and on-premises sources.
- A vast range of platform choices: Power BI, Power BI Pro, and Power BI Premium.
- It supports five languages: SQL, R, Python, DAX, and Power Query
- ML, AI, big data, stream analytics capabilities.
- Content packs and creates real-time visualizations available on all devices.
- Provides the capability to export data for collaboration with other platforms.
- Very user-friendly interface – NLP, drag-and-drop functionality, etc.
- Ad-hoc analytics and reporting.
- Row-level security increases work enthusiasm.
2. Zoho Analytics
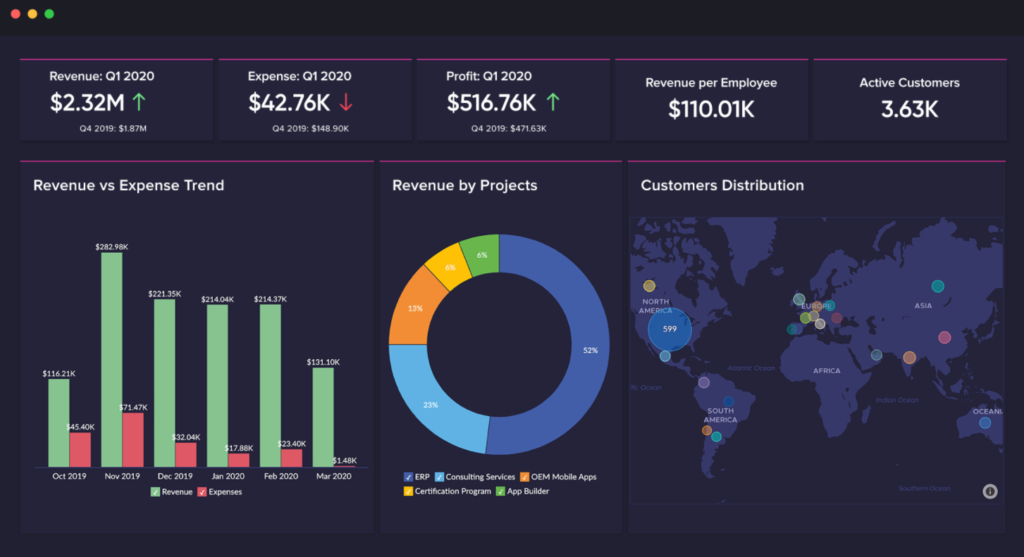
Zoho is another very popular web-based online office suite that offers a self-service Business Intelligence platform called Zoho Analytics. It is also a cloud-based platform that includes on-premise installation. Zoho connects to a wide range of sources to collect data and can auto-merge data from popular business software or via Zoho’s self-service tools.
Zoho Analytics has about 2M users, 500 thousand businesses in its kitty, and 50M reports. We found Zoho Analytics to have one of the most comprehensive third-party connectors. Do check this out!
Top features:
- Allows access to on-premise, cloud, mobile and other devices.
- Requires minimal expertise to use.
- Collects data from various sources and allows automatic synchronization.
- Provides simple drag and drop tools to create visualizations, reports, and dashboards
- It can share reports and dashboards through the web page and application.
- Provides a workspace for collaboration with other platforms.
3.Tableau
Tableau is a very powerful and popular data visualization tool used in Business Intelligence these days. It makes data analytics rapid and robust. Tableau can transform raw data into a very easily understandable format, cleaning data, and identifying underlying trends and patterns with the visualization dashboards and worksheets.
Big companies like Verizon, PepsiCo, Charles Schwab, Coca-Cola are using Tableau to leverage their data and make conclusive informed decisions.
Top features:
- Wide range of clientele and features.
- Provides on-premise, fully hosted and public business intelligence solutions.
- It can integrate data from many sources, either on-premise or cloud-based.
- Delivers intuitive, self-service analytics for users without technical knowledge
- You can install it on-premise, Tableau cloud, public cloud
- Creates exclusive real-time visualizations in just a few clicks.
- Allows access on web and mobile devices.

4. YellowFin
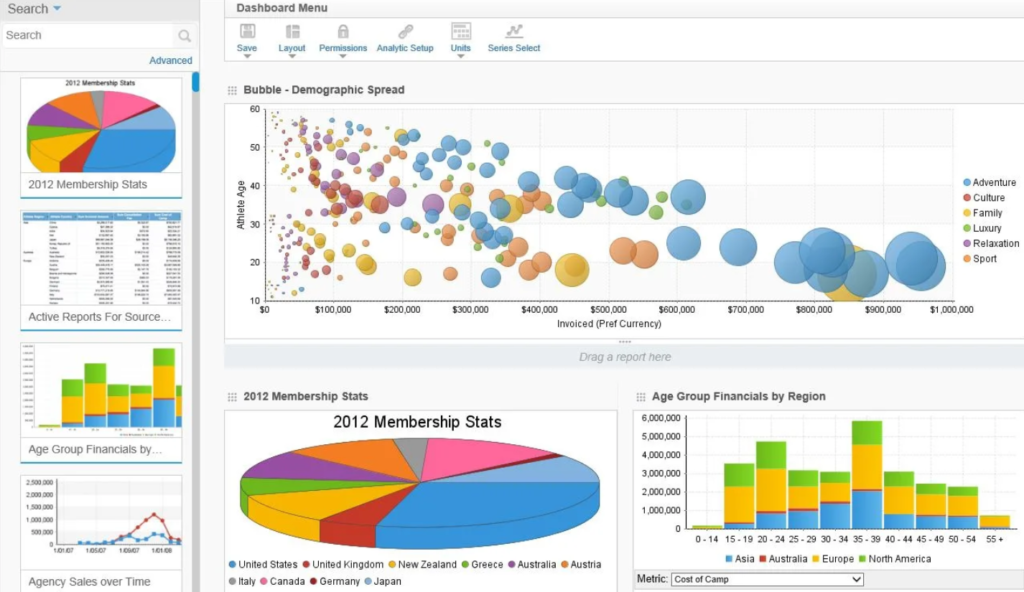
Another popular business intelligence platform consisted of dashboards, stories, signals, data discovery, and data prep is YellowFin. It’s a single integrated solution developed for companies across varying industries that offers numerous features, including a mobile app available both for Android and iOS devices.
Top features:
- Access dashboards from anywhere: the web page, company intranet, wiki, or mobile device.
- Mapping mobile BI like features helps the user to access and monitor business-related data from anywhere they want.
- It also allows faster, smarter, and collective decision-making via its user-friendly user interface.
- Data-rich presentations and interactive reports can be made effective through user’s insights.
- This BI tool also supports the business decision-making process, which helps the big and small companies.
5. MicroStrategy
This is an enterprise analytics and mobility platform focused on, federated analytics, hyperintelligence and cloud-based solutions. MicroStrategy also offers numerous features and enable users to build interactive books of analytics that render on iOS or Android devices. You can also download a sample app, the Library app, or MicroStrategy Mobile, where you will be able to deploy analytics on-the-go.
Top features:
- It has hyperintelligence feature pulls the data from various sources and puts them into relevant, zero-click insights.
- Provides a common data glossary and built on an enterprise semantic graph enables visualizations of the same data.
- They also offer mobile deployment, which enables users to leverage existing dashboards, reports, and visualizations in real-time, from any location and device.
- Also offers voice integration technology powered by machine learning and natural language process.
- Offers a range of solutions to deliver secure, scalable, and flexible solutions that meet the needs of both business departments and IT.
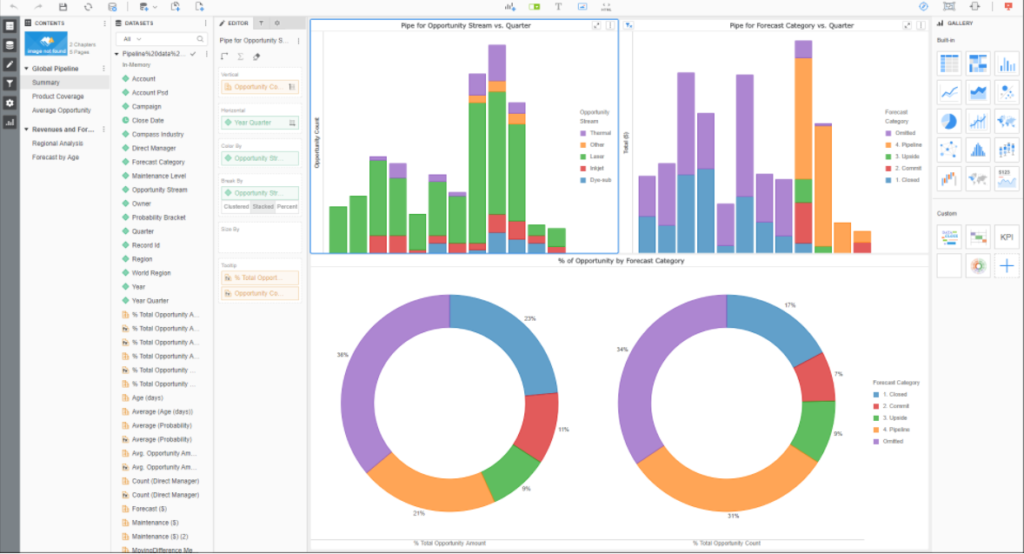
6. QlikView
If you are thinking of pie charts, pivot tables, line charts, bar charts, and more, QlikView is a tool that is widely used across domains in the industry.
QlikView again is a Business Intelligence data discovery tool when the goal is to create guided dashboards and analytics applications for targeted business challenges. The software enables users to uncover data and relationships insights across different variables.
QlikView uses an in-memory data model and its capable of manipulating huge data sets instantly with accuracy.
Top Features:
- It provides a unified interface for gathering and manipulating data.
- Allows access to on-premise and cloud mobile and website services.
- QlikView assists users with AI-driven suggestions to create analytics and make it easier for users.
- It can create click and go visualizations and interactive reports.
- Allows for advanced analytics calculations from Python and R.
- Centralizes analytics and apps to enable collaboration.
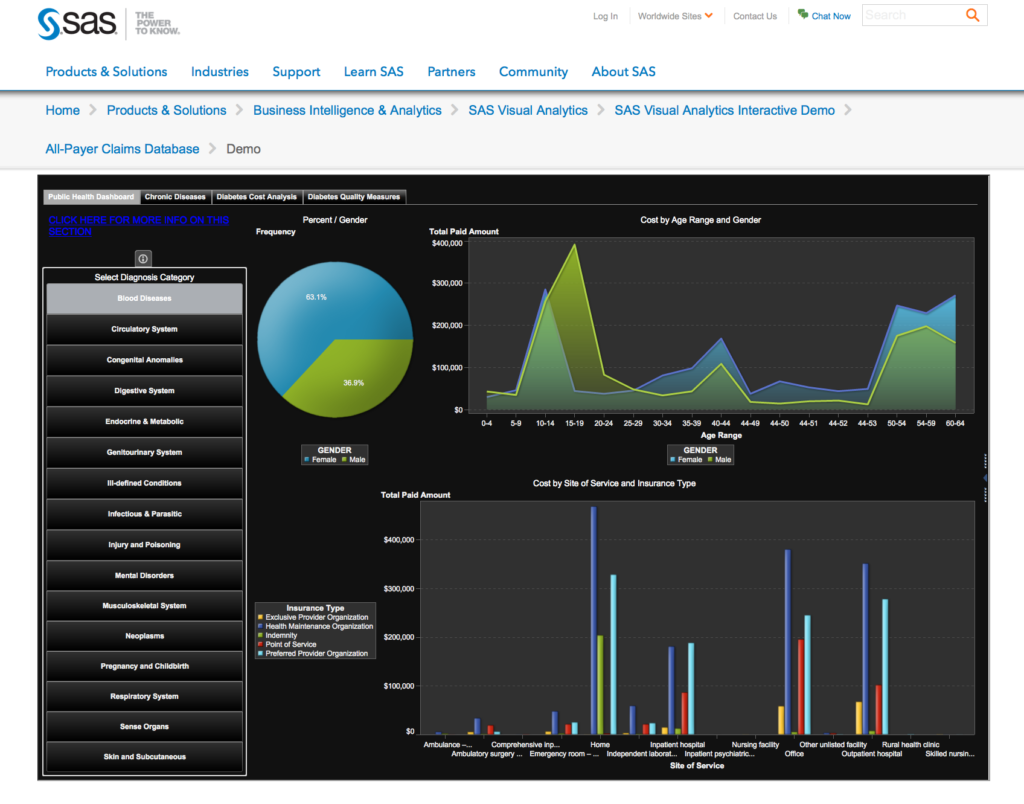
7. SAS (Statistical Analytical System)
SAS is another software solution that offers numerous products and technologies for data scientists, data engineers, text analysts, forecasting analysts, econometricians, and optimization modellers, among others. Founded in the 70s, SAS Business Intelligence enjoys a long tradition in the market, building and expanding its products every year.
Top Features:
- Very strong Data Analysis ability for insights and analytics.
- Has access to data from more than 60 data sources- PC files, RDBMS, Amazon Redshift, Hadoop, and other data warehouse appliances with a single SAS Business Analytics license.
- It enables full integration with analytics pipeline.
- Comes with an interactive, self-service, easy-to-use interface for profiling, cleansing and blending data.
- Capable of doing advanced analytics without coding — correlation, forecasting, decision trees, text analytics and more.
- It provides an integrated environment for self-service data discovery, reporting and world-class analytics.
8. Looker
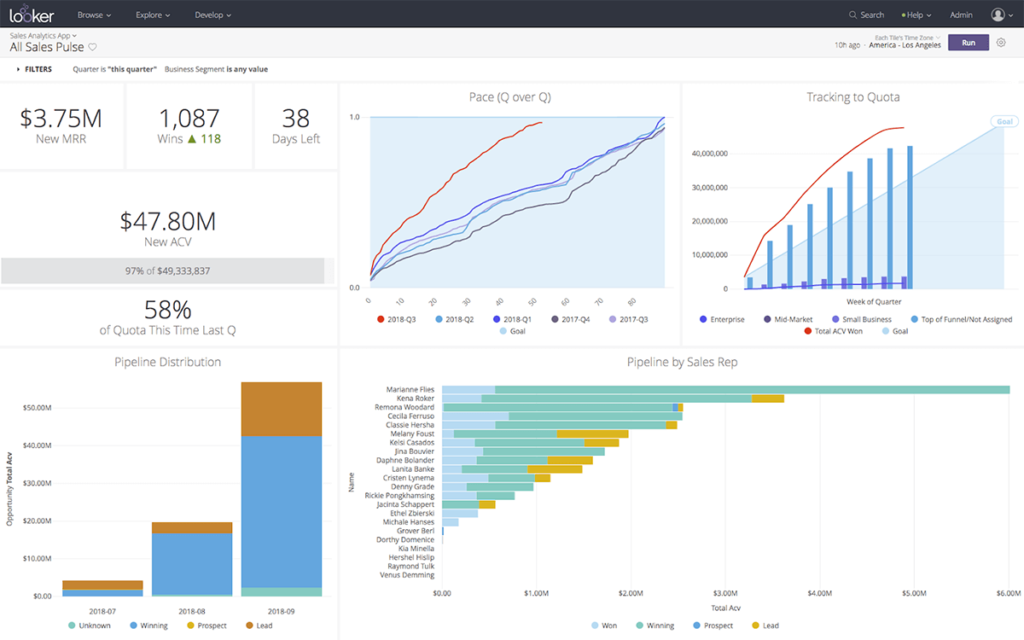
Looker is a browser-based Business Intelligence (BI) platform, simple to use, easy to choose, create customize, and a number of interactive visualizations, and providing a variety of charts and graphs to choose from.
It also has the drag and drop dashboard creation, which would prove to be a great help to non-technical users. Reports and visualizations are accessible on all devices and can be exported outside the Looker dashboard for collaboration with others too, a good feature to have, right?
Top Features:
- Connects to the user SQL database and other similar data warehouses.
- It provides a proprietary LookML syntax for query optimization.
- Installs on-premise or in a Looker-hosted cloud.
- Can create real-time visualizations which are available on all devices.
- Also has drag and drop features for dashboard creation.
- Allows access on web and mobile devices.
- Provides the capability to export visualizations for collaboration with others.
9. SAP
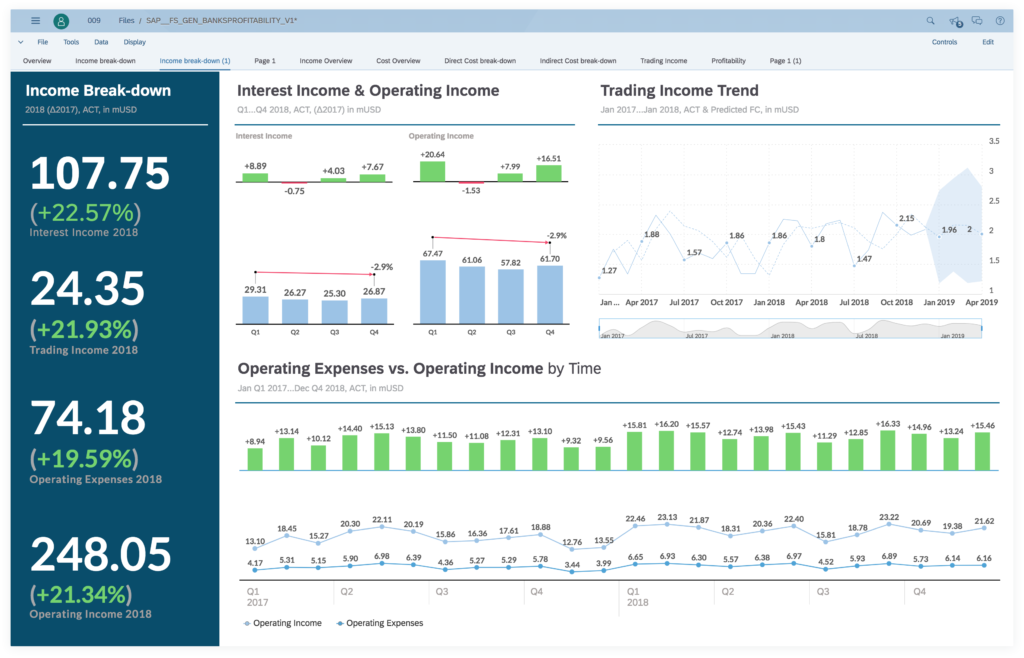
SAP is a business intelligence suite that provides Office integrations with PowerPoint and Excel. Here, you can create hybrid analytics and live presentations that connects to their on-premise and cloud SAP systems. They’re focused on business categories such as ERP and digital core, CRM and customer experience, digital supply chain, HR and people engagement, and many more. More than 170M users leverage SAP across the world, making it one of the largest software suppliers in the world.
Top Features:
- Ad hoc queries and a complex BI enterprise reporting system designed to guide your overall company strategy.
- Self-service capabilities on analytics applications and data visualization, similar to other tools, where you can build your own role-based dashboards and applications.
- It has cross-enterprise sharing functionality that will enable you to communicate your findings with others.
- You can connect with SAP Business Information Warehouse (SAP BW) or SAP HANA and can manipulate data with real-time analytics.
- You can analyze larger volumes of data by using Microsoft Excel with SAP and embed analytics in PowerPoint, making this solution easily integrated with Office.
10. IBM Cognos Analytics
The quintessential business intelligence suite by IBM is a cloud-based BI and analytics platform.
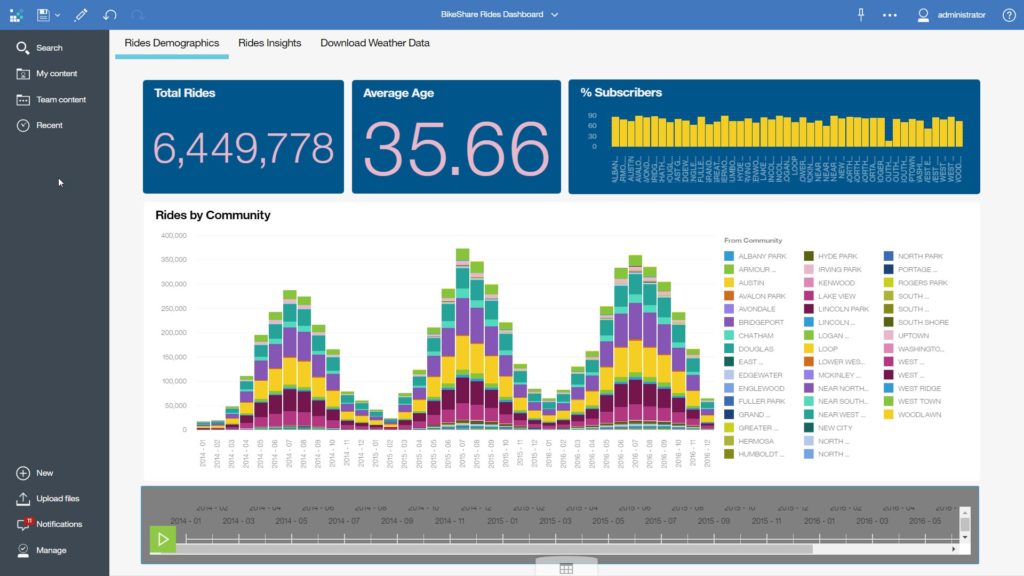
Cognos Analytics imports data from a wide range of sources to help create interactive dashboards, reports and visualizations. It has diverse users; from large to small businesses.
Moreover, IBM defines Cognos Analytics as an AI-infused decision-making tool which has a very distinguishing feature of this platform is the use of a mobile app to view charts, receive alerts, and get real-time updates.
Top Features
- Convenient team sharing of content via web, email, and Slack.
- It has storytelling with a large number of format options.
- Like others, it also allows install and access on-premise or cloud.
- Shares reports & dashboards through webpage, email, Slack or other platforms.
- Uses machine learning to assess and combine related sources.
- Creates interactive dashboards, visualizations, and reports with AI recommendations.
Closing Note
In this digital and data era, Business Information and Intelligence have climbed up the ladder of important business skills to a great extent. Learning about BI tools and be proficient at using them is a great deal in the corporate world. So, why fall behind? Cheer up and start learning from today to become a master at BI tools.


0 responses on "Top 10 Business Intelligence BI Tools with Top Features"